
Deal Analytics Internship @ SONY Music Publishing
Jun - Aug 2025
Analyzed artist streaming data to identify healthy catalog growth patterns.
My research quantified optimal top-song contribution percentages across popularity tiers and introduced the "Dominance Ratio" metric. Findings helped assess artist development potential, guiding A&R strategies for sustainable success.
Tools included:
APIs: Luminate, Chartmetric, Spotify
Databases: Snowflake, Mediabase, MLC, Genius
Artist & Repertoire (A&R) in Sony
-

What A&R Is
A&R (Artists and Repertoire) is the division of a record label or music publisher responsible for talent scouting, artist development, and overseeing the creative process.
A&R teams identify promising artists and songs, negotiate deals, and guide projects to commercial success by combining artistic intuition with data-driven insights.
-

A&R @ Sony Music Publishing
The Sony A&R team’s main goals are to leverage data to:
Identify hit songs (market share/profitability) and forecast revenue.
Evaluate writer potential (3-year projections based on historical performance).
Develop tools/reports to streamline decision-making (e.g., trend analysis, credit research).
-

My Role @ A&R
As a Deal Analytics Intern, I assisted with A&R’s goals by:
Building SQL queries in Snowflake and analyzed Luminate/Spotify API data to track post-signing artist performance
Identifying 20+ unsigned writers from Mediabase/MLC datasets with rising chart traction for A&R outreach.
Prototyping Python scripts to automate API pulls from Spotify/Chartmetric, reducing manual data collection

Artist Collaborations & Remix Strategy: What is Working
During my time at Sony as an intern, I conducted a data-driven study to identify the most effective collaboration and remix strategies for artists across popularity tiers—revealing how to maximize streaming impact and fanbase growth.
Using Spotify API, Luminate, and Chartmetric data, I analyzed 50K+ tracks from early-stage to superstar artists (1K–10M+ monthly listeners), comparing joint albums, featured tracks, and remixes. Key metrics included streaming longevity, cross-tier performance gaps, and lifecycle trends to pinpoint what drives sustainable success versus fleeting spikes.
Goal, Process and Findings
What I Did:
Identify which collaboration and remix strategies drive sustainable streaming growth across artist tiers (early to superstar).

How I Did It:
Data Collection:
Analyzed 50K+ tracks (Top 50K U.S. Songs, 2024–2025) via Spotify API, Luminate, and Chartmetric
Segmented artists by monthly listeners: Early (1K–500K), Established (1M–5M), Superstar (10M+).
Comparative Analysis:
Collaborations: Compared streams of featured vs. solo tracks on the same albums, isolating impact by artist tier.
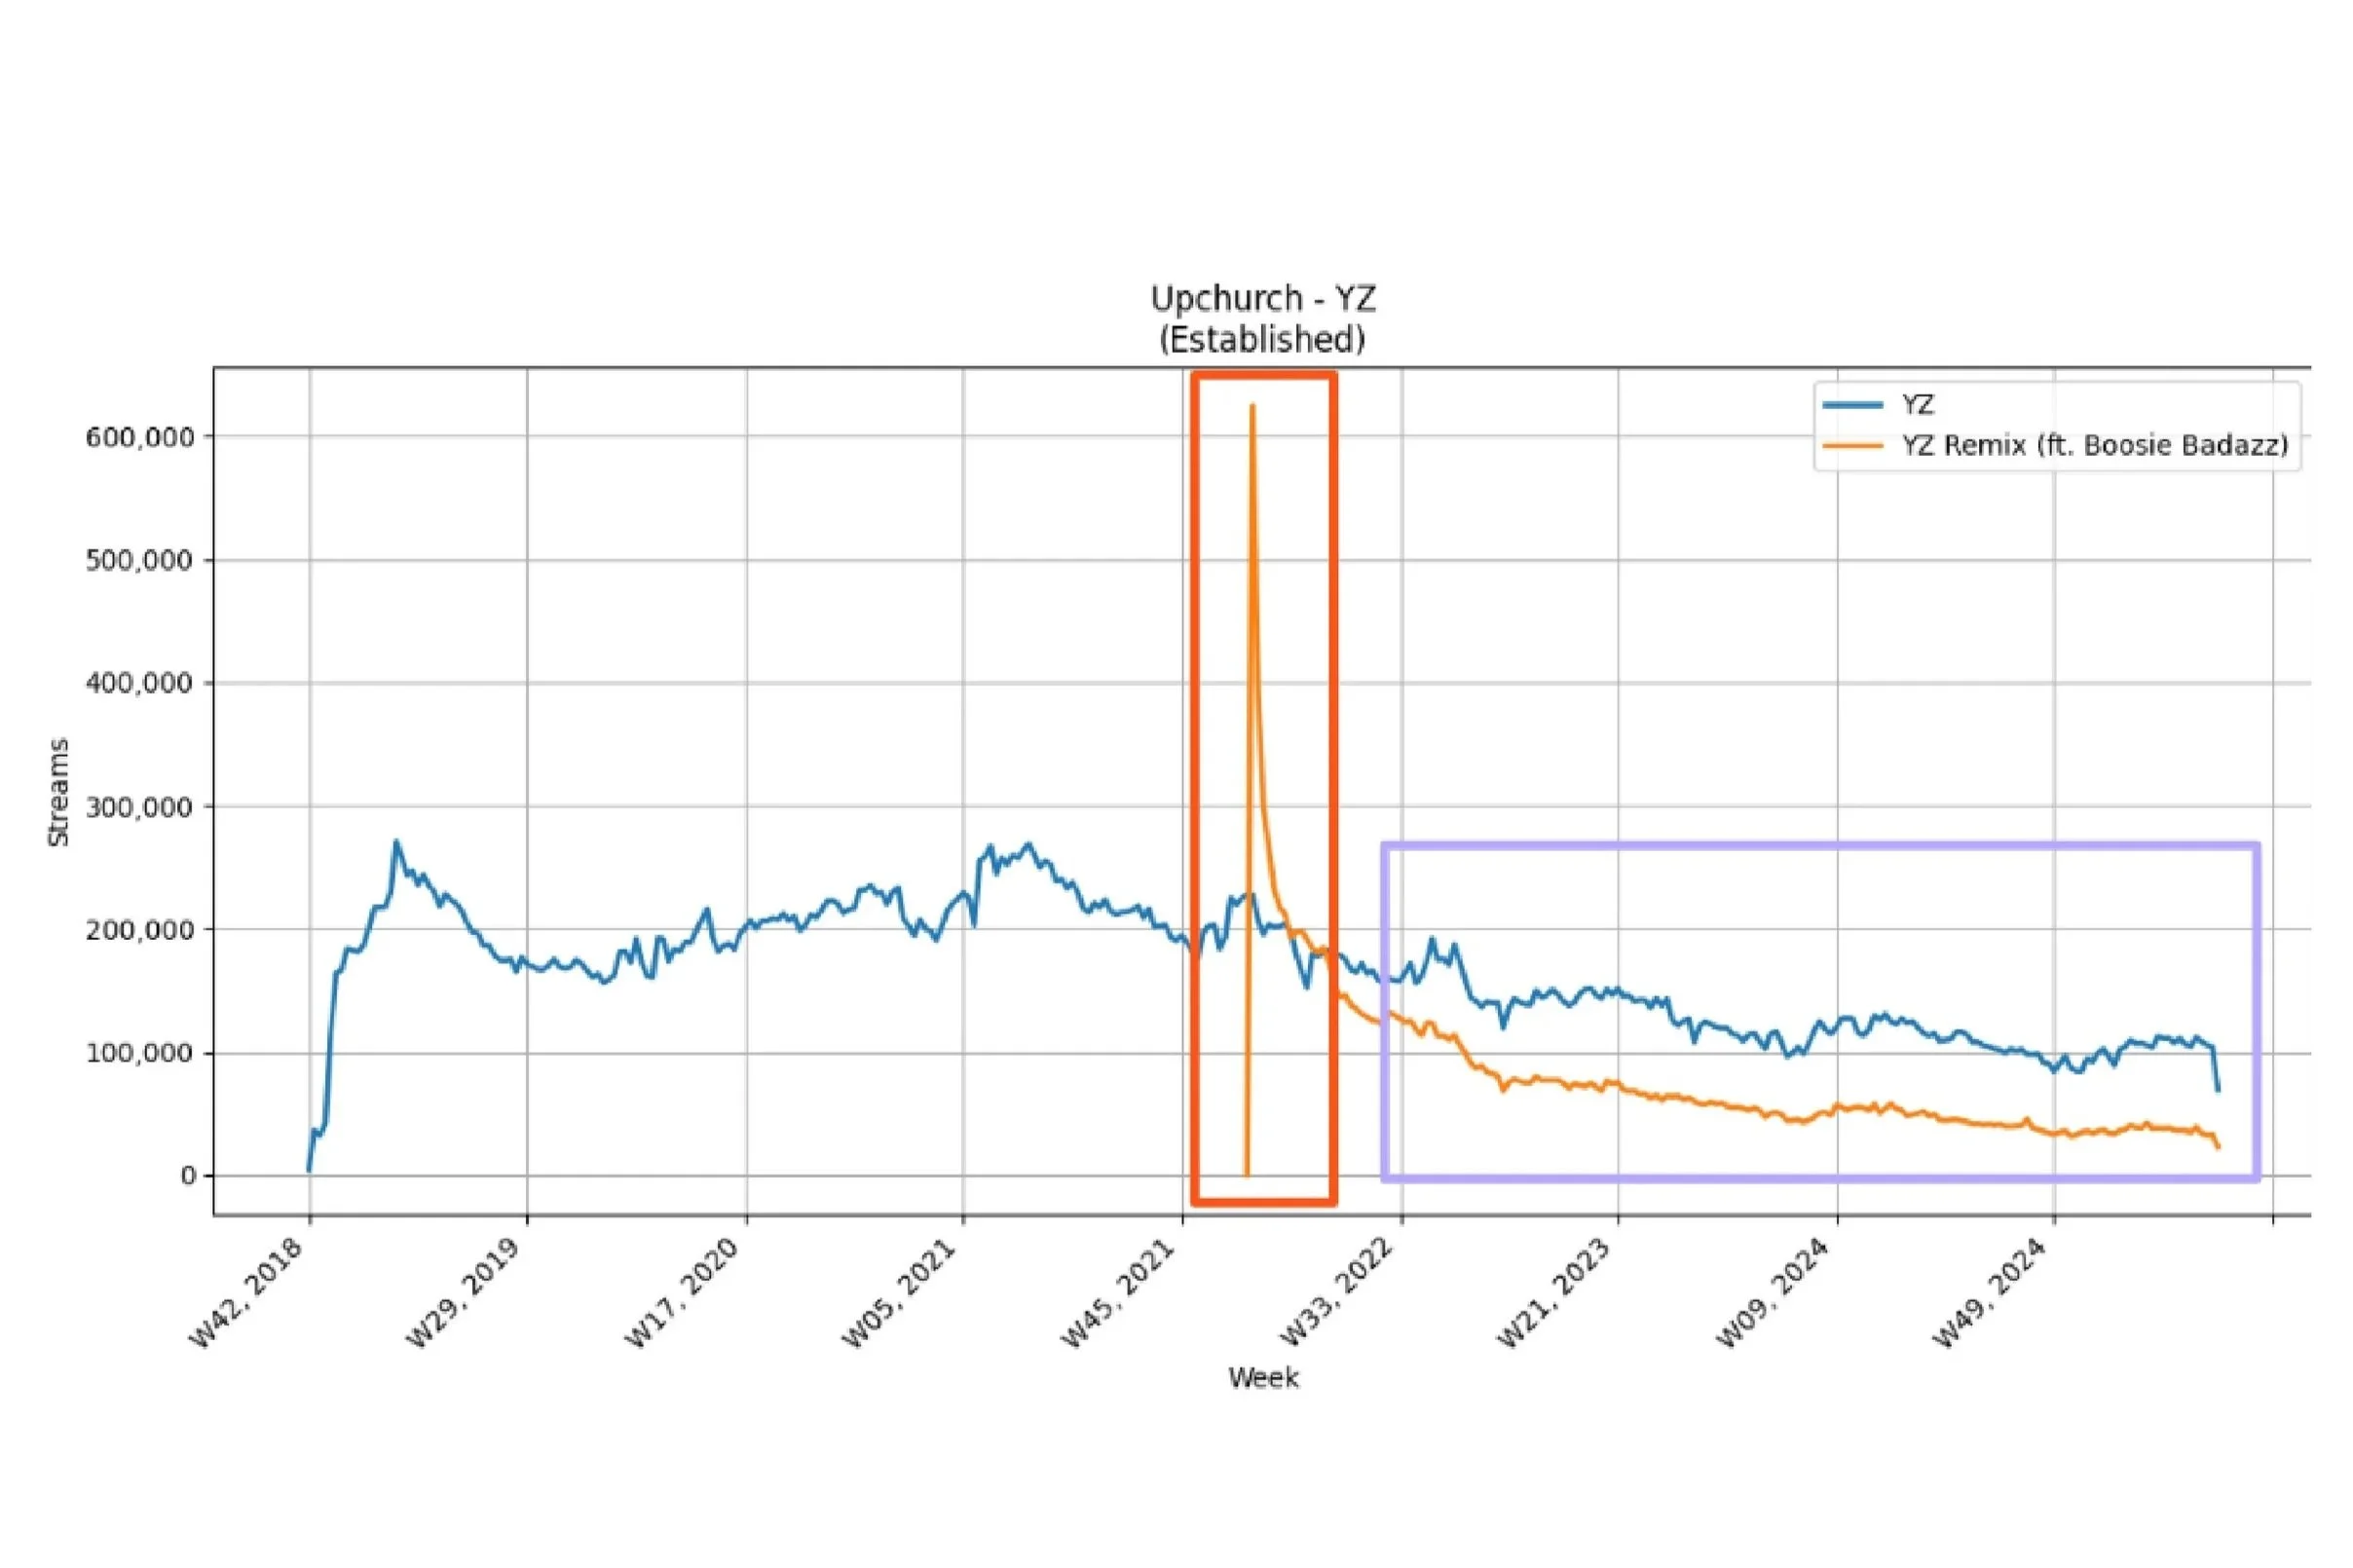
Remixes: Tracked lifecycle of remixes vs. originals (peak velocity, decay rate, effect on original’s streams).
Tools:
Built Snowflake queries to clean streaming data
Visualized streaming trends to compare song / album level performances
What I Found:
Collaborations That Work:
Superstars benefit more from collaborations compared to lower tier artists, with featured songs consistently outperforming solo works in both short and long run
For emerging artists, songs from joint albums (e.g., Alex Isley & Jack Dine’s Marigold) have longer longevity than one-off features (even with superstars) by >40% in sustained streams (e.g. Soyoon’s Smoke Sprite (ft. RM)).
Remix Realities:
Short Lifespan: >90% of remixes decline >60% in streams within 4 weeks, even if it features multiple superstars (e.g. XG’s remix with Jackson Wang and Ciara)
Best Timing: Successful remixes (part of Top 50K Songs in the past 3 years) are majority released within 3 months of the original song
Tier-Specific Insights:
Early artists gain more sustained exposure from co-releasing joint albums, while superstars benefit from strategic features.
Remixes rarely “re-trend” and have no long-term impact on original songs’ performance.


Why It Matters:
These insights guide Sony when pitching artist collaborations across popularity levels for potential signings, while cautioning against over-relying on remixes due to their short lifecycle.
By pinpointing the most effective collaboration formulas for each career stage, these insights help optimize artist works’ long-term growth over fleeting virality.
For a deeper dive into song lifecycle trends and remix decay rates, feel free to reach out!
The Process

To assess what constitutes a "healthy" artist catalog, I targeted the 3 main steps below:
1. Collected & Cleaned Data:
I pulled weekly streaming metrics (artist-level and top song streams) for 24 artists across genres and popularity tiers using Luminate and Spotify API data, and standardized chart-week comparisons to control for initial release spikes.
2. Developed Metrics:
I calculated the top song % (top song streams / total artist streams) per artist, and proposed the Dominance Ratio (DR) to contextualize top song’s strength:
DR = (top song %) / (expected % if all songs were equally popular).
3. Categorized Growth Patterns into 1 of 3:
1) Standard: Artists with non-static, decreasing top song %
2) Outliers: One-hit wonders or artists with atypical spikes
3) Unhealthy Examples: Artists with stagnant, dominant top songs (>70% contribution).
Top Song % Analysis: Quantifying Healthy Catalog Growth
At Sony Music Publishing, I led a data-driven analysis to determine the optimal contribution of an artist’s top song to their total streams—a key indicator of sustainable success.
Using Luminate and Spotify API data, I tracked 24 artists across tiers (1M–50M+ weekly streams), measuring top song % trends, catalog diversification, and the newly developed Dominance Ratio (DR) metric.
The Findings

Data visualizations compiled from the streaming data yielded the following results:
Healthy Growth Benchmarks:
Artists breaking into 1M+ weekly streams have a median top song % of ~40%, though variation is expected
Sustainable artists breaking into 5M+ weekly streams should have a top song % that stabilizes at ~12-35%
DR >10 signals strong catalog depth (e.g., Gracie Abrams at 50M+ streams: 17% top song %, DR=13.6) and may indicate unbalanced catalogue health
Red Flags that indicate “unhealthy” artist catalogue:
If the top song % increases over time or remains >70%.
Top song remains static despite new releases throughout career
Actionable Insight:
A&R teams should prioritize artists with declining top song % + high DR, indicating diversified hits and long-term potential.
Why It Mattered:
This framework helps Sony identify writers/artists with scalable catalogs—not just fleeting hits—while flagging over-reliance on a single song — predicting which artists will still matter in 5 years.
For a visualization of these insights (e.g. tiered benchmarks or DR case studies), feel free to reach out!